Federal electoral district in Nova Scotia, Canada
Kings—Hants Nova Scotia electoral district Nova Scotia electoral district |
|---|
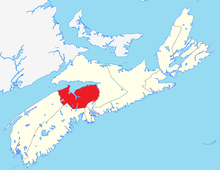 Kings—Hants in relation to the other Nova Scotia federal electoral districts (2003 boundaries) |
| Federal electoral district |
|---|
| Legislature | House of Commons |
|---|
| MP | Kody Blois
Liberal |
|---|
| District created | 1966 |
|---|
| First contested | 1968 |
|---|
| Last contested | 2021 |
|---|
| District webpage | profile, map |
|---|
| Demographics |
|---|
| Population (2016)[1] | 83,465 |
|---|
| Electors (2021) | 71,285 |
|---|
| Area (km²)[1] | 4,124 |
|---|
| Pop. density (per km²) | 20.2 |
|---|
| Census division(s) | Hants, Kings |
|---|
| Census subdivision(s) | Cambridge 32, East Hants, Glooscap 35, Hantsport, Indian Brook 14, Kentville, Kings, Subd. A, Kings, Subd. B, Kings, Subd. C, Kings, Subd. D, West Hants, Windsor, Wolfville |
|---|
Kings—Hants (formerly Annapolis Valley—Hants and Annapolis Valley) is a federal electoral district in Nova Scotia, Canada, that has been represented in the House of Commons of Canada since 1968.
Demographics
Historical population| Year | Pop. | ±% |
|---|
| 2001 | 79,286 | — |
|---|
| 2006 | 81,531 | +2.8% |
|---|
| 2011 | 83,306 | +2.2% |
|---|
| 2016 | 83,465 | +0.2% |
|---|
- According to the 2016 Canadian census; 2013 representation[2][3][4]
Ethnic groups: 91.5% White, 5.3% Aboriginal, 1.6% Black
Languages: 96.1% English, 1.4% French
Religions (2011): 71.7% Christian (17.4% Baptist, 17.1% Catholic, 15.3% United Church, 12.5% Anglican, 1.7% Presbyterian, 1.5% Pentecostal, 6.1% Other), 27.4% No religion
Median income (2015): $31,020
Average income (2015): $39,385
Geography
The district includes all of Hants County and the eastern part of Kings County. Communities include Enfield, Elmsdale, Lantz, Kentville, Windsor and Wolfville.
History
The electoral district was created as "Annapolis Valley in 1966 from parts of Colchester—Hants and Digby—Annapolis—Kings ridings.
In 1996, it was renamed "Kings—Hants". In 2003, it was given its current boundaries: the area encompassed by the provincial electoral district of Kings West was removed from Kings—Hants and added to West Nova. There was no territory changes as a result of the 2012 federal electoral redistribution.
Members of Parliament
This riding has elected the following members of Parliament:
Scott Brison resigned his seat effective 10 February 2019.[5] Under legislation that had recently come into effect, the seat remained vacant until the next general election.[6]
Election results
Graphs are unavailable due to technical issues. There is more info on Phabricator and on MediaWiki.org. |
Graph of election results in Annapolis Valley, Annapolis Valley—Hants, Kings—Hants (minor parties that never got 2% of the vote or didn't run consistently are omitted)
Kings—Hants
Graphs are unavailable due to technical issues. There is more info on Phabricator and on MediaWiki.org. |
Graph of election results in Kings—Hants (minor parties that never got 2% of the vote or didn't run consistently are omitted)
2021
| 2021 Canadian federal election |
| Party | Candidate | Votes | % | ±% | Expenditures |
| | Liberal | Kody Blois | 20,192 | 44.92 | +1.61 | $80,518.90 |
| | Conservative | Mark Parent | 13,234 | 29.44 | +4.66 | $54,740.13 |
| | New Democratic | Stephen Schneider | 8,645 | 19.23 | +2.05 | $13,834.66 |
| | People's | Steven Ford | 1,945 | 4.33 | +2.69 | $0.00 |
| | Green | Sheila G. Richardson | 940 | 2.09 | -10.46 | $4,644.16 |
| Total valid votes/expense limit | 44,956 | 100.00 | – | $107,126.60 |
| Total rejected ballots | 251 |
| Turnout | 45,207 | 63.42 | -5.34 |
| Registered voters | 71,285 |
| | Liberal hold | Swing | -1.53 |
| Source: Elections Canada[7] |
2019
| 2019 Canadian federal election |
| Party | Candidate | Votes | % | ±% | Expenditures |
| | Liberal | Kody Blois | 20,806 | 43.31 | −27.43 | $62,750.09 |
| | Conservative | Martha MacQuarrie | 11,905 | 24.78 | +6.20 | $48,454.21 |
| | New Democratic | Stephen Schneider | 8,254 | 17.18 | +10.76 | $28,020.03 |
| | Green | Brogan Anderson | 6,029 | 12.55 | +9.19 | $12,592.53 |
| | People's | Matthew Southall | 786 | 1.64 | New | $3,504.18 |
| | Rhinoceros | Nicholas Tan | 138 | 0.29 | −0.11 | none listed |
| | Veterans Coalition | Stacey Dodge | 118 | 0.25 | New | $0.00 |
| Total valid votes/expense limit | 48,036 | 99.32 | | $101,328.14 |
| Total rejected ballots | 327 | 0.68 | +0.25 |
| Turnout | 48,363 | 68.76 | −1.00 |
| Eligible voters | 70,332 |
| | Liberal hold | Swing | −16.81 |
| Source: Elections Canada[9] |
2015
| 2015 Canadian federal election |
| Party | Candidate | Votes | % | ±% | Expenditures |
| | Liberal | Scott Brison | 33,026 | 70.74 | +31.19 | $88,355.31 |
| | Conservative | David Morse | 8,677 | 18.59 | –18.05 | $80,877.49 |
| | New Democratic | Hugh Curry | 2,998 | 6.42 | –13.60 | $15,831.09 |
| | Green | Will Cooper | 1,569 | 3.36 | –0.42 | $1,277.65 |
| | Rhinoceros | Megan Brown-Hodges | 184 | 0.39 | – | $730.27 |
| | Independent | Edd Twohig | 132 | 0.28 | – | $1,070.96 |
| | Independent | Cliff James Williams | 100 | 0.21 | – | – |
| Total valid votes/Expense limit | 46,686 | 99.57 | | $200,775.69 |
| Total rejected ballots | 202 | 0.43 |
| Turnout | 46,888 | 70.56 |
| Eligible voters | 66,454 |
| | Liberal hold | Swing | +24.62 |
| Source: Elections Canada[10][11] |
2011
| 2011 Canadian federal election |
| Party | Candidate | Votes | % | ±% | Expenditures |
| | Liberal | Scott Brison | 15,887 | 39.56 | -4.62 | $74,312.84 |
| | Conservative | David Morse | 14,714 | 36.63 | +10.49 | $79,610.04 |
| | New Democratic | Mark Rogers | 8,043 | 20.03 | -1.98 | $30,929.92 |
| | Green | Sheila Richardson | 1,520 | 3.78 | -2.46 | $1,566.57 |
| Total valid votes/Expense limit | 40,164 | 100.0 | | $82,155.51 |
| Total rejected, unmarked and declined ballots | 200 | 0.50 | +0.01 |
| Turnout | 40,364 | 61.76 | +3.17 |
| Eligible voters | 65,355 |
| | Liberal hold | Swing | -7.56 |
| Sources:[12][13] |
2008
| 2008 Canadian federal election |
| Party | Candidate | Votes | % | ±% | Expenditures |
| | Liberal | Scott Brison | 16,641 | 44.18 | -1.38 | $57,579.50 |
| | Conservative | Rosemary Segado | 9,846 | 26.14 | -6.05 | $59,850.46 |
| | New Democratic | Carol Harris | 8,291 | 22.01 | +2.99 | $19,364.79 |
| | Green | Brendan MacNeill | 2,353 | 6.24 | +4.04 | $2,914.98 |
| | Christian Heritage | Jim Hnatiuk | 528 | 1.40 | – | $11,240.76 |
| Total valid votes/Expense limit | 37,659 | 100.0 | | $79,171 |
| Total rejected, unmarked and declined ballots | 187 | 0.49 | +0.08 |
| Turnout | 37,846 | 58.59 | -6.60 |
| Eligible voters | 64,593 |
| | Liberal hold | Swing | +2.34 |
2006
| 2006 Canadian federal election |
| Party | Candidate | Votes | % | ±% | Expenditures |
| | Liberal | Scott Brison | 19,491 | 45.56 | -1.05 | $74,044.26 |
| | Conservative | Bob Mullan | 13,772 | 32.19 | +2.07 | $65,675.63 |
| | New Democratic | Mary Dewolfe | 8,138 | 19.02 | +1.33 | $19,691.41 |
| | Green | Sheila Richardson | 947 | 2.21 | -1.41 | $1,181.00 |
| | Marijuana | Chummy Anthony | 436 | 1.02 | – | none listed |
| Total valid votes/Expense limit | 42,784 | 100.0 | | $74,073 |
| Total rejected, unmarked and declined ballots | 177 | 0.41 | -0.35 |
| Turnout | 42,961 | 65.19 | +2.77 |
| Eligible voters | 65,898 |
| | Liberal hold | Swing | -1.56 |
2004
| 2004 Canadian federal election |
| Party | Candidate | Votes | % | ±% | Expenditures |
| | Liberal | Scott Brison | 17,555 | 46.61 | +16.11 | $68,487.35 |
| | Conservative | Bob Mullan | 11,344 | 30.12 | -19.42 | $64,737.24 |
| | New Democratic | Skip Hambling | 6,663 | 17.69 | +0.08 | $24,085.01 |
| | Green | Kevin Stacey | 1,364 | 3.62 | – | $2,710.55 |
| | Christian Heritage | Jim Hnatiuk | 493 | 1.31 | – | $7,088.07 |
| | Independent | Richard Hennigar | 242 | 0.64 | +0.34 | $5,710.00 |
| Total valid votes/Expense limit | 37,661 | 100.0 | | $70,804 |
| Total rejected, unmarked and declined ballots | 289 | 0.76 |
| Turnout | 37,950 | 62.42 |
| Eligible voters | 60,801 |
| | Liberal gain from Progressive Conservative | Swing | +18.56 |
| Changes from 2000 are based on redistributed results. Changes for Liberal candidate Scott Brison from 2000 are based on the Liberal Party's results. He received +6.48% votes from his results as a Progressive Conservative. Conservative Party change is based on the combination of Canadian Alliance and Progressive Conservative Party totals. Change for independent candidate Richard Hennigar is based on his 2000 results as a Natural Law candidate (results not redistributed). |
2000
All changes are based on the 2000 by-election, except the Liberal Party and the Natural Law Party, which did not field a candidate; and Communist Party candidate Graham Jake MacDonald, who ran as an Independent.
2000 by-election
| Canadian federal by-election, September 11, 2000 |
| Party | Candidate | Votes | % | ±% | Expenditures |
| | Progressive Conservative | Joe Clark | 14,525 | 53.45 | +17.18 | $38,552 |
| | New Democratic | Kaye Johnson | 7,375 | 27.14 | +8.17 | $45,722 |
| | Alliance | Gerry Fulton | 4,385 | 16.14 | +2.75 | $40,044 |
| | Marijuana | Alex Néron | 670 | 2.47 | | $371 |
| | Independent | John Turmel | 221 | 0.81 | | $0 |
| Total valid votes | 27,176 | 100.00 |
| Total rejected ballots | 232 |
| Turnout | 27,408 | 39.54 |
| Electors on the lists | 69,319 |
| Cause of by-election: resignation of Scott Brison on July 24, 2000. Canadian Alliance percentages are contrasted with the Reform Party figures from 1997. Sources: Official Results, Elections Canada and Financial Returns, Elections Canada. |
1997
Annapolis Valley—Hants
Graphs are unavailable due to technical issues. There is more info on Phabricator and on MediaWiki.org. |
Graph of election results in Annapolis Valley—Hants (minor parties that never got 2% of the vote or didn't run consistently are omitted)
1993
Changes from the 1988 election for both Progressive Conservative candidate Jim White and Independent candidate Pat Nowlan are based on the same 1988 result, when Pat Nowlan ran as a Progressive Conservative. Independent Rik Gates was the youngest candidate to run for MP at the age of twenty two.
1988
1984
1980
1979
Annapolis Valley
Graphs are unavailable due to technical issues. There is more info on Phabricator and on MediaWiki.org. |
Graph of election results in Annapolis Valley (minor parties that never got 2% of the vote or didn't run consistently are omitted)
1974
1972
1968
See also
References
Notes
- ^ a b Statistics Canada: 2011
- ^ "Census Profile, 2016 Census - Kings--Hants [Federal electoral district], Nova Scotia and Nova Scotia [Province]". February 8, 2017.
- ^ "Statistics Canada: 2011 Census Profile". February 8, 2012.
- ^ "2011 National Household Survey Profile - Federal electoral district (2013 Representation Order)". May 8, 2013.
- ^ "Scott Brison bids farewell to House of Commons, announces resignation date". Halifax Today. The Canadian Press. February 6, 2019.
- ^ "A Federal Seat is Vacant in Kings–Hants" (Press release). Elections Canada. February 22, 2019.
- ^ "September 20, 2021 General Election Election Results". Elections Canada. Retrieved September 22, 2021.
- ^ "Transposition of Votes from the 44th General Election to the 2023 Representation Orders". Elections Canada. Retrieved April 9, 2024.
- ^ "Official Voting Results". Elections Canada. Retrieved September 22, 2021.
- ^ "October 19, 2015 Election Results — Kings—Hants (Validated results)". Elections Canada. October 21, 2015. Retrieved October 24, 2015.
- ^ Elections Canada – Preliminary Election Expenses Limits for Candidates Archived 2015-08-15 at the Wayback Machine
- ^ Elections Canada – Official voting results, Forty-first general election, 2011
- ^ Elections Canada – Candidate's electoral campaign return, 41st general election
External links
 Nova Scotia electoral district


