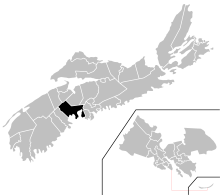
Chester-St. Margaret's
Provincial electoral district in Nova Scotia, Canada
 Nova Scotia electoral district Nova Scotia electoral district | |||
|---|---|---|---|
 | |||
| Provincial electoral district | |||
| Legislature | Nova Scotia House of Assembly | ||
| MLA |
Progressive Conservative | ||
| District created | 1956 | ||
| Last contested | 2021 | ||
| Demographics | |||
| Population (2011) | 20,368 | ||
| Electors | 15,291 | ||
| Area (km²) | 1,661 | ||
| Pop. density (per km²) | 12.3 | ||
| Census division(s) | Halifax RM, Lunenburg County | ||
Chester—St. Margaret's is a provincial electoral district in Nova Scotia, Canada, that elects one member of the Nova Scotia House of Assembly. It is located on the South Shore.
The constituency was created in 1956 as a division of Lunenburg County. It was called Lunenburg East from 1956 to 1993. In 1993, the district was renamed Chester—St. Margaret's and gained Tancook Islands from Lunenburg Centre and St. Margaret's Bay from Halifax St. Margarets. In 2003, it gained the communities of West Dover and Bayside. In 2012, the district lost the Upper Tantallon area north of Highway 103 to Hammonds Plains-Lucasville.[1]
The district includes the Municipality of Chester and the communities in the Halifax Regional Municipality along the coast of St. Margarets Bay including Peggys Cove. Major towns in the riding include Hubbards, Chester, Western Shore, Boutiliers Point and Head of St. Margarets Bay.
Geography
The land area of Chester-St. Margaret's is 1,661 km2 (641 sq mi).[2]
Statistics
Avg. Income: $27,440 (2003)
Population: 19,720 (2003)
Post-secondary education: 36% (2003)
Members of the Legislative Assembly
This riding has elected the following members of the Legislative Assembly:
| Legislature | Years | Member | Party | |
|---|---|---|---|---|
| 64th | 2021-Present | Danielle Barkhouse | Progressive Conservative | |
| 63rd | 2020-2021 | Hugh MacKay | Independent | |
| 2017–2020 | Liberal | |||
| 62nd | 2013–2017 | Denise Peterson-Rafuse | New Democratic | |
| 61st | 2009–2013 | |||
| 60th | 2006-2009 | Judy Streatch | Progressive Conservative | |
| 59th | 2005-2006 | |||
| 2003-2005 | John Chataway | Progressive Conservative | ||
| 58th | 1999-2003 | |||
| 57th | 1998-1999 | Hinrich Bitter-Suermann | New Democratic | |
| 1998 | Progressive Conservative | |||
| 56th | 1993-1998 | Jim Barkhouse | Liberal | |
| 55th | 1988-1993 | |||
| 54th | 1984-1988 | |||
| 53rd | 1981-1984 | Ron Barkhouse | Progressive Conservative | |
| 52nd | 1978-1981 | |||
| 51st | 1974-1978 | |||
| 50th | 1970-1974 | Maurice L. Zinck | ||
| 49th | 1967-1970 | |||
| 48th | 1963-1967 | |||
| 47th | 1960-1963 | |||
| 46th | 1959-1960 | |||
| 1956-1959 | R. Clifford Levy | |||
Election results
1956
| 1956 Nova Scotia general election: Lunenburg East | ||||||||
|---|---|---|---|---|---|---|---|---|
| Party | Candidate | Votes | % | ±% | ||||
| Progressive Conservative | R. Clifford Levy | 1,887 | 54.44% | – | ||||
| Liberal | Kirk S. Hennigar | 1,579 | 45.56% | – | ||||
| Total | 3,466 | – | ||||||
Source(s) Source: Nova Scotia Legislature (2021). "Electoral History for Chester-St. Margaret's" (PDF). nslegislature.ca. | ||||||||
1960
| 1960 Nova Scotia general election: Lunenburg East | ||||||||
|---|---|---|---|---|---|---|---|---|
| Party | Candidate | Votes | % | ±% | ||||
| Progressive Conservative | Maurice L. Zinck | 2,140 | 58.37% | 3.93% | ||||
| Liberal | Kirk S. Hennigar | 1,405 | 38.33% | -7.23% | ||||
| Co-operative Commonwealth | Albro Boehner | 121 | 3.30% | – | ||||
| Total | 3,666 | – | ||||||
Source(s) Source: Nova Scotia Legislature (2021). "Electoral History for Chester-St. Margaret's" (PDF). nslegislature.ca. | ||||||||
1963
| 1963 Nova Scotia general election: Lunenburg East | ||||||||
|---|---|---|---|---|---|---|---|---|
| Party | Candidate | Votes | % | ±% | ||||
| Progressive Conservative | Maurice L. Zinck | 2,267 | 63.17% | 4.79% | ||||
| Liberal | Charles E. Harris | 1,322 | 36.83% | -1.49% | ||||
| Total | 3,589 | – | ||||||
Source(s) Source: Nova Scotia Legislature (2021). "Electoral History for Chester-St. Margaret's" (PDF). nslegislature.ca. | ||||||||
1967
| 1967 Nova Scotia general election: Lunenburg East | ||||||||
|---|---|---|---|---|---|---|---|---|
| Party | Candidate | Votes | % | ±% | ||||
| Progressive Conservative | Maurice L. Zinck | 2,100 | 55.87% | -7.30% | ||||
| Liberal | Fred Porter Jr. | 1,659 | 44.13% | 7.30% | ||||
| Total | 3,759 | – | ||||||
Source(s) Source: Nova Scotia Legislature (2021). "Electoral History for Chester-St. Margaret's" (PDF). nslegislature.ca. | ||||||||
1970
| 1970 Nova Scotia general election: Lunenburg East | ||||||||
|---|---|---|---|---|---|---|---|---|
| Party | Candidate | Votes | % | ±% | ||||
| Progressive Conservative | Maurice L. Zinck | 2,092 | 51.31% | -4.55% | ||||
| Liberal | Eric Hagen | 1,985 | 48.69% | 4.55% | ||||
| Total | 4,077 | – | ||||||
Source(s) Source: Nova Scotia Legislature (2021). "Electoral History for Chester-St. Margaret's" (PDF). nslegislature.ca. | ||||||||
1974
| 1974 Nova Scotia general election: Lunenburg East | ||||||||
|---|---|---|---|---|---|---|---|---|
| Party | Candidate | Votes | % | ±% | ||||
| Progressive Conservative | Ron Barkhouse | 2,536 | 53.04% | 1.73% | ||||
| Liberal | Joe Saunders | 1,963 | 41.06% | -7.63% | ||||
| New Democratic | A. W. (Tony) E. Zinck | 282 | 5.90% | – | ||||
| Total | 4,781 | – | ||||||
Source(s) Source: Nova Scotia Legislature (2021). "Electoral History for Chester-St. Margaret's" (PDF). nslegislature.ca. | ||||||||
1978
| 1978 Nova Scotia general election: Lunenburg East | ||||||||
|---|---|---|---|---|---|---|---|---|
| Party | Candidate | Votes | % | ±% | ||||
| Progressive Conservative | Ron Barkhouse | 3,386 | 66.93% | 13.89% | ||||
| Liberal | Wally MacDonald | 1,417 | 28.01% | -13.05% | ||||
| New Democratic | Robert Whiting (Sr.) | 256 | 5.06% | -0.84% | ||||
| Total | 5,059 | – | ||||||
Source(s) Source: Nova Scotia Legislature (2021). "Electoral History for Chester-St. Margaret's" (PDF). nslegislature.ca. | ||||||||
1981
| 1981 Nova Scotia general election: Lunenburg East | ||||||||
|---|---|---|---|---|---|---|---|---|
| Party | Candidate | Votes | % | ±% | ||||
| Progressive Conservative | Ron Barkhouse | 2,802 | 55.49% | -11.45% | ||||
| Liberal | Dave Cook | 1,180 | 23.37% | -4.64% | ||||
| New Democratic | Janet Mooney | 1,068 | 21.15% | 16.09% | ||||
| Total | 5,050 | – | ||||||
Source(s) Source: Nova Scotia Legislature (2021). "Electoral History for Chester-St. Margaret's" (PDF). nslegislature.ca. | ||||||||
1984
| 1984 Nova Scotia general election: Lunenburg East | ||||||||
|---|---|---|---|---|---|---|---|---|
| Party | Candidate | Votes | % | ±% | ||||
| Liberal | Jim Barkhouse | 2,696 | 49.06% | 25.70% | ||||
| Progressive Conservative | David Hatt | 1,764 | 32.10% | -23.38% | ||||
| New Democratic | Janet Mooney | 1,035 | 18.84% | -2.31% | ||||
| Total | 5,495 | – | ||||||
Source(s) Source: Nova Scotia Legislature (2021). "Electoral History for Chester-St. Margaret's" (PDF). nslegislature.ca. | ||||||||
1988
| 1988 Nova Scotia general election: Lunenburg East | ||||||||
|---|---|---|---|---|---|---|---|---|
| Party | Candidate | Votes | % | ±% | ||||
| Liberal | Jim Barkhouse | 3,024 | 50.02% | 0.96% | ||||
| Progressive Conservative | Richard P. Eldridge | 2,352 | 38.91% | 6.81% | ||||
| New Democratic | Wanda Broome | 623 | 10.31% | -8.53% | ||||
| Independent | Malcolm Callaway | 46 | 0.76% | – | ||||
| Total | 6,045 | – | ||||||
Source(s) Source: Nova Scotia Legislature (2021). "Electoral History for Chester-St. Margaret's" (PDF). nslegislature.ca. | ||||||||
1993
| 1993 Nova Scotia general election | ||||||||
|---|---|---|---|---|---|---|---|---|
| Party | Candidate | Votes | % | ±% | ||||
| Liberal | Jim Barkhouse | 5,025 | 51.69% | 1.67% | ||||
| Progressive Conservative | Aileen Heisler | 2,867 | 29.49% | -9.42% | ||||
| New Democratic | Jack Ross | 1,644 | 16.91% | 6.61% | ||||
| Independent | Malcolm Callaway | 185 | 1.90% | 1.14% | ||||
| Total | 9,721 | – | ||||||
Source(s) Source: Nova Scotia Legislature (2021). "Electoral History for Chester-St. Margaret's" (PDF). nslegislature.ca. | ||||||||
1998
| 1998 Nova Scotia general election | ||||||||
|---|---|---|---|---|---|---|---|---|
| Party | Candidate | Votes | % | ±% | ||||
| Progressive Conservative | Hinrich Bitter-Suermann | 3,256 | 35.22% | 5.72% | ||||
| Liberal | Jim Barkhouse | 3,153 | 34.10% | -17.59% | ||||
| New Democratic | Doris Maley | 2,837 | 30.68% | 13.77% | ||||
| Total | 9,246 | – | ||||||
Source(s) Source: Nova Scotia Legislature (2021). "Electoral History for Chester-St. Margaret's" (PDF). nslegislature.ca. | ||||||||
1999
| 1999 Nova Scotia general election | ||||||||
|---|---|---|---|---|---|---|---|---|
| Party | Candidate | Votes | % | ±% | ||||
| Progressive Conservative | John Chataway | 4,193 | 45.27% | 10.06% | ||||
| New Democratic | Hinrich Bitter-Suermann | 3,098 | 33.45% | 2.76% | ||||
| Liberal | Karen Willis Duerden | 1,971 | 21.28% | -12.82% | ||||
| Total | 9,262 | – | ||||||
Source(s) Source: Nova Scotia Legislature (2021). "Electoral History for Chester-St. Margaret's" (PDF). nslegislature.ca. | ||||||||
2003
| 2003 Nova Scotia general election | ||||||||
|---|---|---|---|---|---|---|---|---|
| Party | Candidate | Votes | % | ±% | ||||
| Progressive Conservative | John Chataway | 3,451 | 37.30% | -7.97% | ||||
| New Democratic | Hinrich Bitter-Suermann | 3,412 | 36.87% | 3.43% | ||||
| Liberal | Mitt Larsen | 2,249 | 24.31% | 3.03% | ||||
| Nova Scotia Party | Sue Gault | 141 | 1.52% | – | ||||
| Total | 9,253 | – | ||||||
Source(s) Source: Nova Scotia Legislature (2021). "Electoral History for Chester-St. Margaret's" (PDF). nslegislature.ca. | ||||||||
2005 by-election
| Party | Candidate | Votes | % | ±% | |
|---|---|---|---|---|---|
| Progressive Conservative | Judy Streatch | 2,955 | 36.18 | -1.15 | |
| Liberal | Rick Fraughton | 2,548 | 31.20 | +6.95 | |
| New Democratic Party | Hinrich Bitter-Suermann | 2,434 | 29.80 | -7.10 | |
| Green | Michael Oddy | 210 | 2.57 | – | |
2006
| 2006 Nova Scotia general election | ||||||||
|---|---|---|---|---|---|---|---|---|
| Party | Candidate | Votes | % | ±% | ||||
| Progressive Conservative | Judy Streatch | 3,950 | 42.67% | 5.37% | ||||
| New Democratic | Jane Matheson | 2,833 | 30.60% | -6.27% | ||||
| Liberal | Rick Fraughton | 2,192 | 23.68% | -0.63% | ||||
| Green | Joanne MacKinnon | 282 | 3.05% | – | ||||
| Total | 9,257 | – | ||||||
Source(s) Source: Nova Scotia Legislature (2021). "Electoral History for Chester-St. Margaret's" (PDF). nslegislature.ca. | ||||||||
2009
| 2009 Nova Scotia general election | ||||||||
|---|---|---|---|---|---|---|---|---|
| Party | Candidate | Votes | % | ±% | ||||
| New Democratic | Denise Peterson-Rafuse | 4,835 | 48.09% | 17.49% | ||||
| Progressive Conservative | Judy Streatch | 2,762 | 27.47% | -15.20% | ||||
| Liberal | Jo-Ann Grant | 2,122 | 21.11% | -2.57% | ||||
| Green | Ryan Cameron | 335 | 3.33% | 0.29% | ||||
| Total | 10,054 | – | ||||||
Source(s) Source: Nova Scotia Legislature (2021). "Electoral History for Chester-St. Margaret's" (PDF). nslegislature.ca. | ||||||||
2013
| Party | Candidate | Votes | % | ±% | |
|---|---|---|---|---|---|
| New Democratic Party | Denise Peterson-Rafuse | 3,341 | 35.25 | -12.84 | |
| Progressive Conservative | Janet Elizabeth Irwin | 3,193 | 33.69 | +6.22 | |
| Liberal | Timothy Whitman Harris | 2,943 | 31.06 | +9.95 | |
2017
| ||||||||
|---|---|---|---|---|---|---|---|---|
| Party | Candidate | Votes | % | ±% | ||||
| Liberal | Hugh MacKay | 3,112 | 35.46 | +4.40 | ||||
| New Democratic | Denise Peterson-Rafuse | 3,021 | 34.42 | -0.82 | ||||
| Progressive Conservative | Julie Chaisson | 2,230 | 25.41 | -8.29 | ||||
| Green | Harry Ward | 413 | 4.71 | |||||
| Total valid votes | 8,776 | 100 | ||||||
| Total rejected ballots | 32 | 0.21 | ||||||
| Turnout | 8,808 | 57.60 | ||||||
| Eligible voters | 15,291 | |||||||
| Liberal gain from New Democratic | Swing | +2.61 | ||||||
| Source: Elections Nova Scotia[3][4] | ||||||||
| 2017 provincial election redistributed results[5] | |||
|---|---|---|---|
| Party | Vote | % | |
| Liberal | 2,934 | 35.23 | |
| New Democratic | 2,867 | 34.43 | |
| Progressive Conservative | 2,137 | 25.66 | |
| Green | 390 | 4.68 | |
2021
| ||||||||
|---|---|---|---|---|---|---|---|---|
| Party | Candidate | Votes | % | ±% | Expenditures | |||
| Progressive Conservative | Danielle Barkhouse | 3,788 | 40.06 | +14.40 | $76,695.05 | |||
| Liberal | Jacob Killawee | 3,556 | 37.61 | +2.38 | $67,872.46 | |||
| New Democratic | Amy Reitsma | 1,626 | 17.20 | -17.23 | $50,011.78 | |||
| Green | Jessica Alexander | 417 | 4.41 | -0.27 | $10,917.97 | |||
| Atlantica | Steven Foster | 68 | 0.72 | $200.00 | ||||
| Total valid votes/Expense limit | 9,455 | 99.62 | -0.17 | $88,319.62 | ||||
| Total rejected ballots | 36 | 0.38 | +0.17 | |||||
| Turnout | 9,491 | 62.48 | +4.88 | |||||
| Eligible voters | 15,191 | |||||||
| Progressive Conservative gain from Liberal | Swing | +6.01 | ||||||
| Source: Elections Nova Scotia[6][7] | ||||||||
References
- ^ Constituency History Nova Scotia Legislature
- ^ "Find Your Electoral District for the 41st Provincial General Election". enstools.electionsnovascotia.ca. Elections Nova Scotia.
- ^ "Statement of Votes & Statistics, Volume I" (PDF). Elections Nova Scotia. Retrieved July 17, 2021.
- ^ "May 30th, 2017 - 40th Nova Scotia Provincial General Election". Elections Nova Scotia. Retrieved July 17, 2021.
- ^ Transposition of Votes from the 2017 Provincial General Election to 2019 Electoral District Boundaries
- ^ "Provincial General Election 2021-08-17- Official Results". Elections Nova Scotia. Retrieved October 7, 2021.
- ^ "41st Provincial General Election". Elections Nova Scotia. Retrieved 9 February 2024.
External links
- cbc riding profile
- riding map
- Chester-St.Margaret's June 21, 2005 By-Election Poll-by-Poll Results
- June 13, 2006 Nova Scotia Provincial General Election Poll by Poll Results


